Environmental Protection and Occupational Safety
Carbon Emissions and Energy Management
USI integrates the environment sustainable development principle with business decisionmaking and operation management, and the Board of Directors and senior officers take up the management responsibility and consider the recommendations and expectations of all stakeholders to establish corresponding management policies. In accordance with relevant management systems of ISO 14001, ISO 50001, and ISO 14064-1, the Company's internal management procedures are established. Internal employees' awareness of environmental protection are trained, and material environmental consideration items are identified continuously, such as air pollution, water pollution, wastes, toxic chemicals, noise pollution, soil pollution and energy resources are improved. We are committed to improving and reducing the negative impact of business operations on the environment. Furthermore, we also publicly disclose the Company's environmental information and fulfill corporate environmental responsibilities.
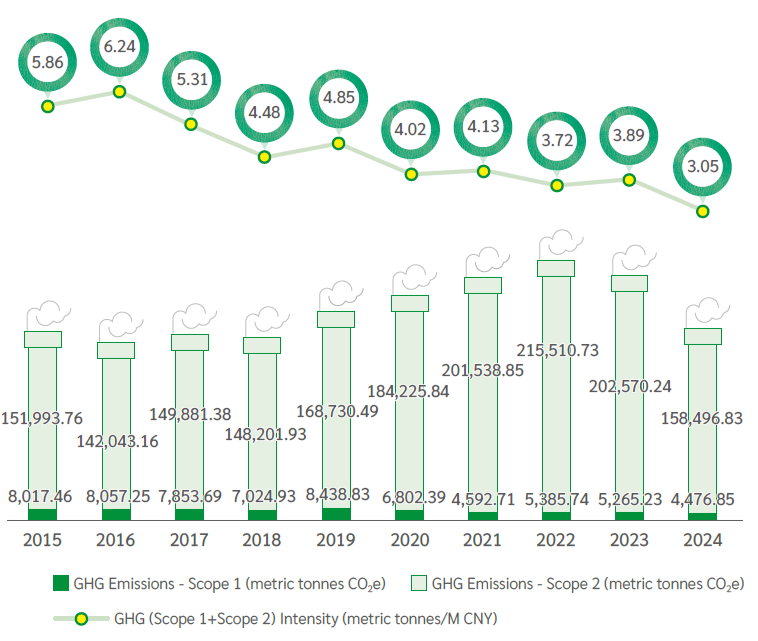
USI continues to promote greenhouse gas reduction policies and conducts internal greenhouse gas inventory in accordance with the ISO 14064-1 standard. It is verified through a third-party verification agency that the total greenhouse gas emissions in 2024 will be 162,973.68 metric tons CO2e (Scope 1 & 2), with 44,861.80 metric tonnes of CO2e reduction from 2023, and the GHG emissions intensity was 3.05 metric tonnes of CO2e, an decrease of 0.84 metric tonnes from 2023.
We conduct 15 categories of significant identification and inventory of upstream and downstream activities in Scope 3, the results of which were verified by a third-party verification unit as follows:
| Category(1) | Description | Greenhouse Gas Emissions |
| 1 | Purchased goods and services | 11,921,464.31 |
| 2 | Capital goods | 37,995.78 |
| 3 | Fuel and energy related activities | 15,604.20 |
| 4 | Upstream transportation and distribution | 179,032.95 |
| 5 | Waste generated in operations | 560.68 |
| 6 | Business travel | 614.85 |
| 7 | Employee commuting | 9,662.48 |
| 8 | Upstream leased assets | 2,623.69 |
| 9 | Downstream transportation and distribution | 14,304.60 |
| 10 | Processing of sold products | N/A(2) |
| 11 | Use of sold products | 982,336.07 |
| 12 | End-of-life treatment of sold products | 9,691.48 |
| 13 | Downstream leased assets | N/A |
| 14 | Franchises | N/A |
| 15 | Investments | 14,733.87 |
| Total | 13,188,624.96 | |
Note:
1. The data presented came from the ISO 14064-1:2018 inventory results, rounded to the 2nd decimal place, converted to the GHG Protocol for disclosure
2. N/A: Non-significant after assessment of the indirect emissions materiality criteria in accordance with ISO 14064-1:2018
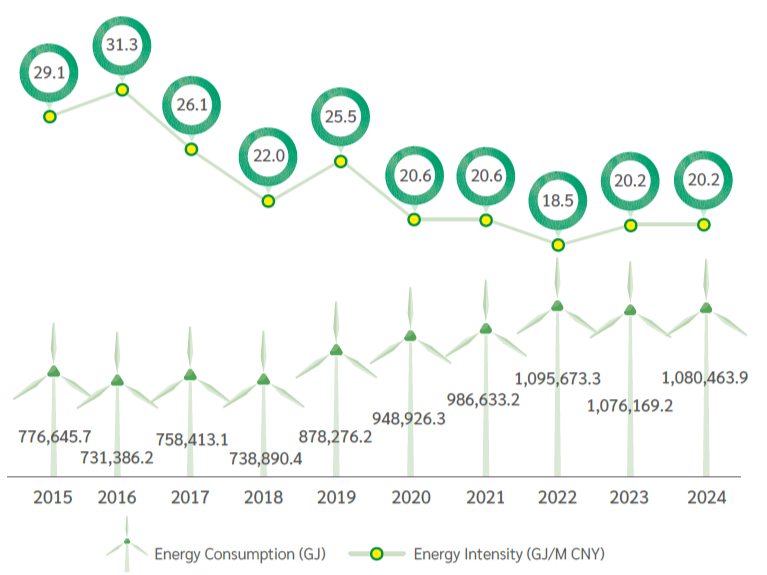
In USI's greenhouse gas emissions profile, approximately 97.3% originates from electricity consumption. Therefore, reducing carbon emissions hinges on improving energy efficiency and optimizing electricity use. In 2024, total energy consumption reached 1,081,144 GJ, covering both manufacturing and office areas. The manufacturing sites accounted for 1,080,464 GJ, an increase of 4,295 GJ compared to 2023. Energy intensity in 2024 was 20.2 GJ per million CNY revenue, consistent with 2023. Compared to the baseline year 2015 (29.1 GJ/million CNY), this represents a 30.6% reduction.
| Category | Direct Energy Consumption | Indirect Energy Consumption | Total Energy Consumption | ||
| Diesel | Gasoline | Natural Gas/Liquid Petrol Gas | Electricity | ||
| 2024 | 858.2 | 2,159.6 | 27,566.2 | 1,049,880.0 | 1,080,463.9 |
| 2023 | 1,225.2 | 2,277.3 | 30,110.9 | 1,042,555.7 | 1,076,169.2 |
| 2022 | 1,266.0 | 2,215.4 | 28,307.9 | 1,063,884.0 | 1,095,673.3 |
| 2021 | 1,335.8 | 2,575.2 | 34,239.0 | 948,483.2 | 986,633.2 |
USI actively responds to the call for renewable energy use. We purchased 243,111 MWh (875,200 GJ) of I-RECs and Green Electricity Certificate (GEC) in 2025 to offset CO2 emitted by traditional power in 2024 (the annual electricity usage for Zhangjiang, Jinqiao, Huizhou, Kunshan, Mexico, and Vietnam Facilities were all offset, Nantou-NK Facility was offset 9%). Low-carbon products produced in facilities using renewable energy account for 83% of USI's annual revenue.
| Category | Item | Scope 1 | Scope 2 | Total |
|---|---|---|---|---|
| Location based | GHG Emissions(Metric tonnes CO2e) | 4,476.85 | 158,496.83 | 162,973.68 |
| Percentage(%) | 3 | 97 | 100 | |
| Market based | GHG Emissions (Metric tonnes CO2e) | 4,476.85 | 162,973.68 | 28,415.25 |
| Percentage(%) | 16 | 84 | 100 |